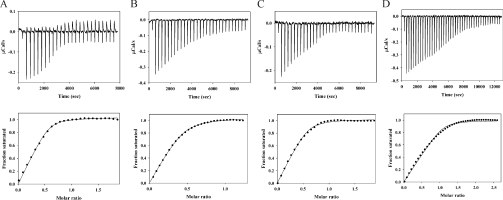
Figure 7. ITC analysis of binding of CR56 to RAP and RAP fragments.
(A) Titration of D1 into 1.8 μM CR56; (B) titration of D2 into 4.6 μM CR56; (C) titration of D3 into 1.8 μM CR56; (D) titration of CR56 into 3 μM RAP. The upper part of each panel gives the raw ITC data for the titration prior to correction for dilution of titrant, and the lower portion gives the best fit of the data to a single site model (A–C) or a two-site model (D).

