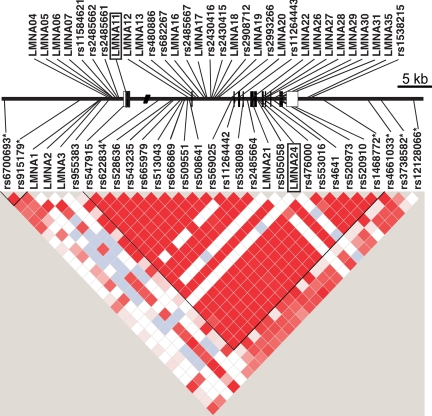
Figure 1.
Schematic of the lamin a/c gene sequencing and genetic analysis. The boxes indicate the location of each exon. The open boxes are nontranslated sequences. The filled boxes are translated exons. The relative location of SNPs is indicated. SNPs identified by sequencing but not included in the association studies are shown above the lamin a/c gene map, and SNPs used for the association studies are shown below the gene map. Asterisks indicate SNPs that were not identified in PCOS subjects but were selected from the database to increase informativeness of the LMNA genomic region. The pair-wise LD (D′) plot was generated with Haploview. Dark red indicates strong LD. White indicates no LD.

