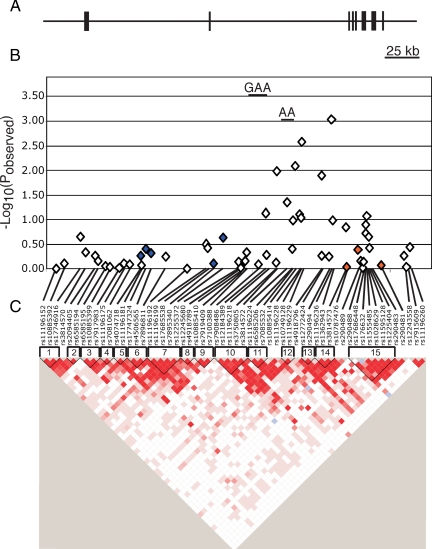
Figure 1.
Schematic of TCF7L2 association study in PCOS. A, TCF7L2 genomic region. The horizontal line indicates the genomic region encompassed in our genetic analysis. The vertical lines indicate the relative positions of the exons of the TCF7L2 gene. B, Association results. The −Log10(pobserved) values are plotted along the y-axis. The relative location of each SNP is indicated along the x-axis. The diamonds correspond to association results of individual SNPs. The short horizontal line corresponds to the haplotype with statistically significant evidence for association with PCOS. Blue diamonds correspond to SNPs that are in LD (D’ > 0.4) with SNPs that are associated with T2D susceptibility SNPs in Caucasians in the Grant et al. study (12), whereas the orange diamonds correspond to variants in LD with SNPs associated with T2D in the Taiwanese cohort (24). C, Pairwise LD (D’) plot. Pairwise D’ results were plotted with Haploview. Dark red indicates strong LD, whereas white indicates no LD. The location and number of each haplotype block are shown above the pairwise LD plot.

