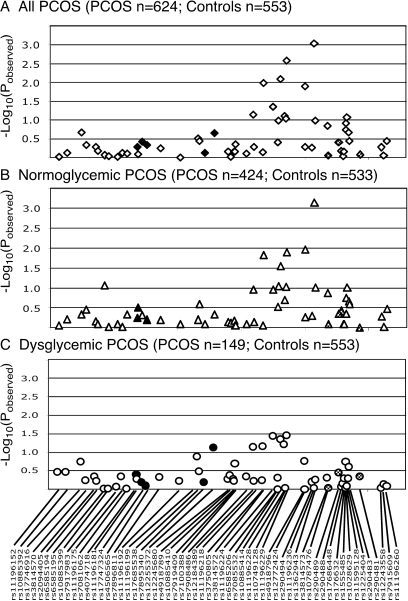
Figure 2.
Association results of PCOS trait in the complete PCOS cohort (A), normoglycemic women with PCOS (B), and glucose-intolerant women with PCOS (C). Black symbols correspond to SNPs that are in LD (D’ > 0.4) with SNPs that are associated with T2D susceptibility SNPs in Caucasians in the Grant et al. study (12), whereas stippled symbols correspond to variants in LD with SNPs associated with T2D in the Taiwanese cohort (24). The −Log10(pobserved) value for each association test is shown along the y-axis, and the location of each SNP is indicated along the x-axis.

