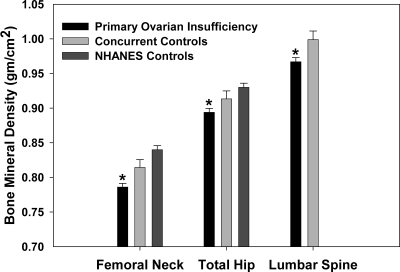
Figure 1.
BMD (g/cm2) of women with POI (n = 353), concurrent controls (n = 70), and NHANES controls (n = 353). *, P < 0.001 compared with either control group indicates statistical significance. The concurrent and NHANES control groups did not differ significantly (P = 0.07). Multiple regression analysis was used to adjust for the effect on bone density of age, BMI, and race. Error bars represent sem.

