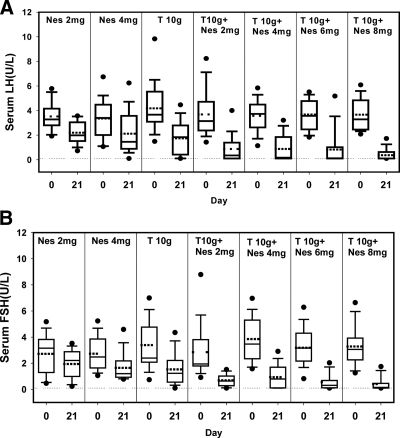
Figure 1.
Serum LH (A) and FSH (B) concentrations before and after transdermal application of NES and T gel for 20 d. The dotted line represents the lower limit of quantification of serum LH and FSH, respectively. Box and whiskers plots are used in all figures where the dark line in the box is the median and the dotted line is the mean concentration. The lower and upper box boundaries represent the 25th and 75th percentiles, the whiskers are the 10th and 90th percentiles, and the dots are values below the 10th or above the 90th percentiles.

