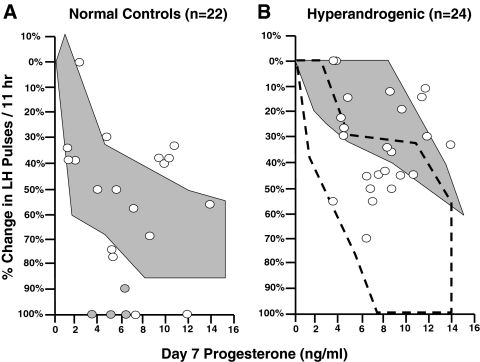
Figure 1.
The percentage change in LH pulse frequency per 11 h after 7 d of oral E2 and P in NC (A) and HA (B) adolescent girls. The data are plotted as a function of mean plasma P on d 7. The white circles represent the Tanner 3-5 girls. The shaded circles represent the Tanner 1-2 girls. The shaded areas represent the range of responses to 7 d of oral E2 and P in NC adult women (A) and adult women with PCOS (B). The outlined area in panel B represents the range of responses in NC adolescent girls.

