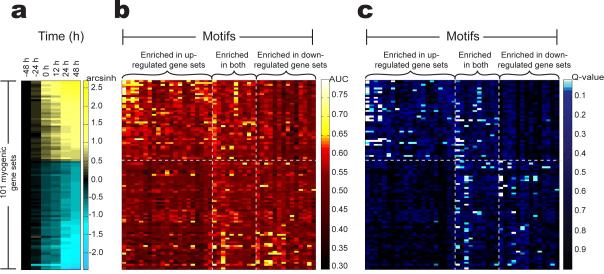
Figure 3. Lever screen of 101 myogenic gene sets using a dictionary of 174 motifs.
(a) Median signal intensity throughout the time-course of gene expression profiling for each of 101 gene sets. (b) AUC scores for each GM-pair when considering each of the 174 motifs from Xie et al.9. (c) FDR Q-value for each GM-pair. We note that in the heat maps shown in (b) and (c), only the 45 motifs with statistically significant enrichment (Q ≤ 0.05) in at least one of the 101 myogenic gene sets are displayed. The columns of matrices (b) and (c) are sorted by decreasing overall correlation with gene expression at time +48 h. The rows of the heat maps shown in (a-c) were sorted in order of decreasing median expression arcsinh values at time point +48 h (relative to -48 h).

