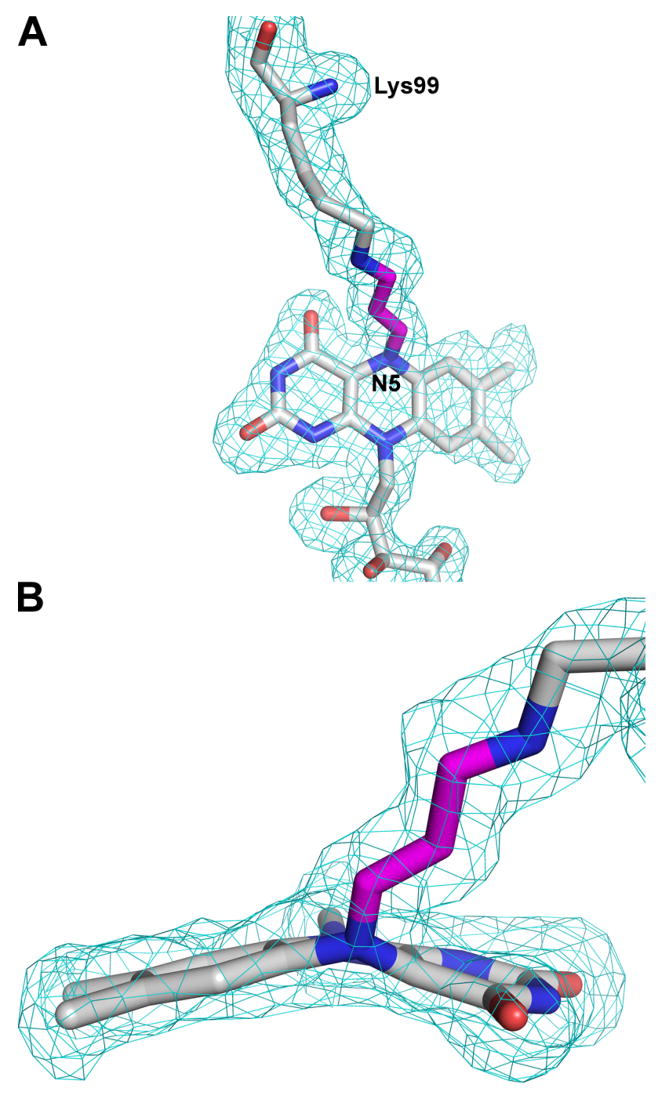
Figure 2.
Two views of the lysine-FAD adduct along with electron density. The map is a simulated annealing σA-weighted Fo - Fc omit map contoured at 2.0 σ. Prior to map calculation, the lysine-flavin adduct was omitted and simulated annealing refinement was performed using PHENIX (47). The model shown is the final refined model. The three-carbon link between the Lys99 and the flavin N5 atom is shown in magenta.

