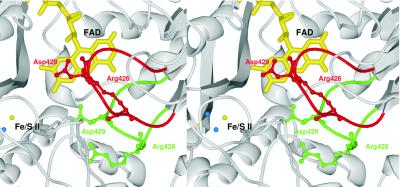
Figure 4.
Stereo representation of the change in conformation shown by an active site loop (Gln 423—Lys 433) on the XDH to XO transition; the green orientation represents the conformation it adopts in XDH and the red trace follows its path in XO. The positions of the side chains of Asp 429 and Arg 426 are indicated; they show dramatic shifts and are the major contributors to the change in electrostatic charge at the flavin site shown in Fig. 5. The view is similar to the one in Fig. 3.

