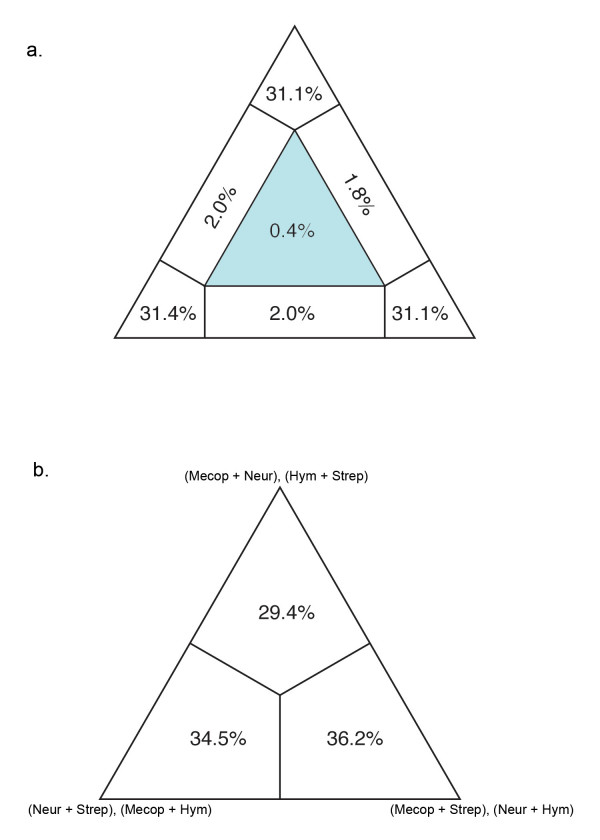
Figure 3.
Conflict visualization using likelihood mapping in Tree Puzzle. (a) The tips of the triangle are considered 'basins of attraction' that contain the likelihoods of the percentage of quartets that are fully resolved. The center of the triangle represents the percentage (0.5%) of quartets that are unresolved; 0.4% indicated that there is not substantial conflict within our dataset [64]. (b) Four-cluster likelihood mapping analysis of Mecopterida, Neuropteroidea, Strepsiptera, and Hymenoptera indicates there is conflicting data supporting the affinity of Strepsiptera to each of these three groups.

