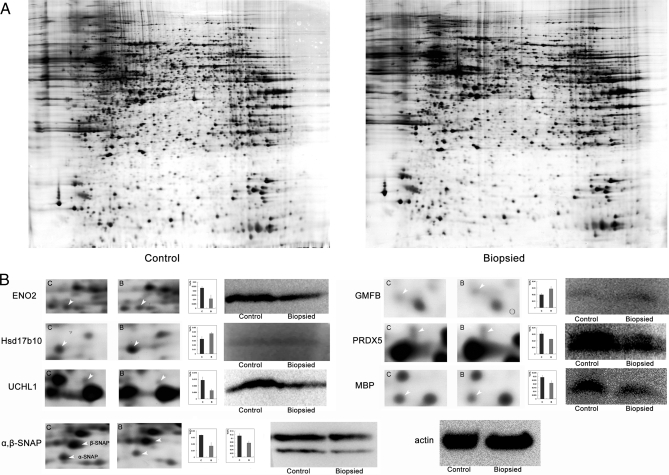
Fig. 4.
Two-dimensional electrophoresis results and validation with Western blotting. A, 2DE maps of proteins extracted from control and biopsied brains. B, magnified comparison maps of spots for ENO2, Hsd17b10, UCHL1, α,β-SNAP, GMFB, PRDX5, and MBP in the 2DE patterns of control and biopsied brains. Bars represent the relative volume (%Vol) of each of the spots on the gels. Error bars represent the standard error of the mean. Western blot analyses of each protein are shown simultaneously. Results are consistent with the results of the 2DE. Actin was used as a loading control.

