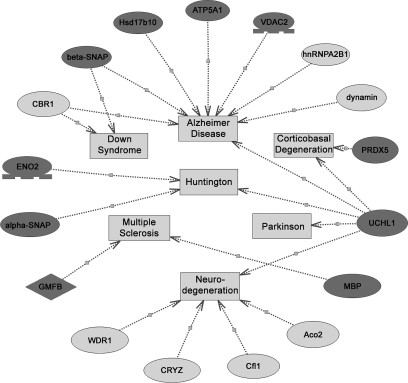
Fig. 5.
Relationships between neurodegenerative disorders with the differentiated proteins in the biopsied brains compared with the control brains as predicted by PathwayStudio software. Proteins are shown as ovals (a dark gray oval means its altered tendency was consistent with the characteristic of neurodegenerative diseases; a light gray oval means its alteration may be compensation for neurodegenerative disorders), and neurodegenerative disorders are represented by squares. Relationships are displayed with arrows and documented by literature citations (details listed in supplemental Table 2). CRYZ, ζ-crystallin.

