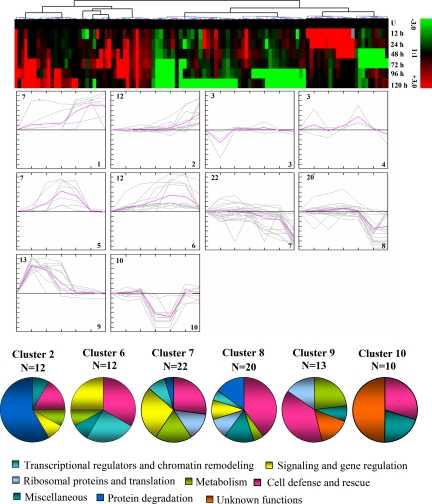
Fig. 8.
Clusterogram of expression profiles of nucleus-specific dehydration-responsive proteins in rice. A time course of dehydration-responsive protein expression in rice nucleus was constructed using 2-D electrophoresis. The differentially expressed 109 proteins were grouped into 10 clusters based on their expression profiles. The SOTA cluster tree is shown at the top, and the expression profiles in clusters are shown below. Each protein is represented by a single column of colored boxes, and each time point is represented by a single row. Induction (or repression) ranges from pale to saturated red (or green). The expression profile of each individual protein in the cluster is depicted by gray lines; the mean expression profile is marked in pink for each cluster. The number of proteins in each cluster is given in the left upper corner, and the cluster number is given in the right lower corner. The clusters with n > 7 were taken into consideration for the study of co-expression patterns for functionally similar proteins. Detailed information on proteins within each cluster can be found in supplemental Fig. 2. U, unstressed.

