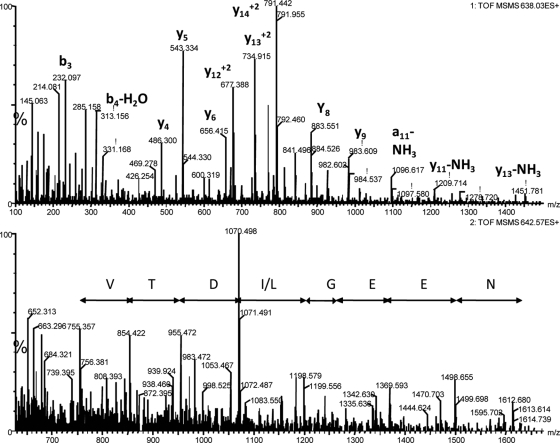
Fig. 10.
MS/MS spectra of potential biomarkers. The top panel shows an MS/MS spectrum of m/z 638.03 (3+) that matched to a uromodulin fragment with sequence SGSVIDQSRVLNLGPITR. The bottom panel shows a spectrum of m/z 642.3 (4+) that did not produce a positive match by database searches. A potential amino acid sequence is shown.

