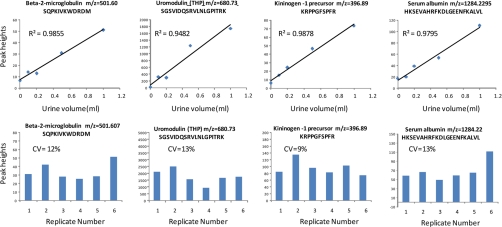
Fig. 3.
Precision and accuracy of signals of endogenous urinary peptides as determined by label-free LC-MS. The top panel graphs show that the intensities of representative urinary peptides were linear relative to the amount of sample analyzed by LC-MS. The bottom graphs show the reproducibilities of signal intensities generated in replicate LC-MS runs. CVs were defined as mean/S.D. × 100. THP, Tamm-Horsfall glycoprotein

