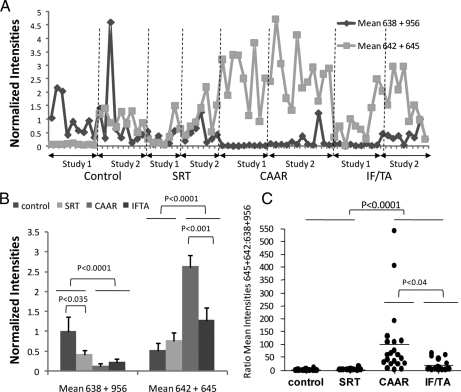
Fig. 6.
A combination of biomarkers better discriminates CAD and controls subjects and classifies chronic allograft dysfunction into clinical subtypes. A, the mean intensities of the molecular ions with the indicated m/z values were plotted for each of the 39 patients and 32 controls in training (Study 1) and validation (Study 2) experiments. B, these means were statistically different in CAD and control subjects. Graphs represent mean ± S.E. of the means shown in A with statistical significances shown for pairwise comparisons. Kruskal-Wallis analysis returned a p < 0.0001. C, ratio of the means of 638–956 to 642–645 is also a useful indicator of CAD. Values were obtained by obtaining the ratio of the values shown in A for each patient and were statically significant by Kruskal-Wallis test at p < 0.0001. p values obtained by Dunn's multiple comparison tests are shown in the figure.

