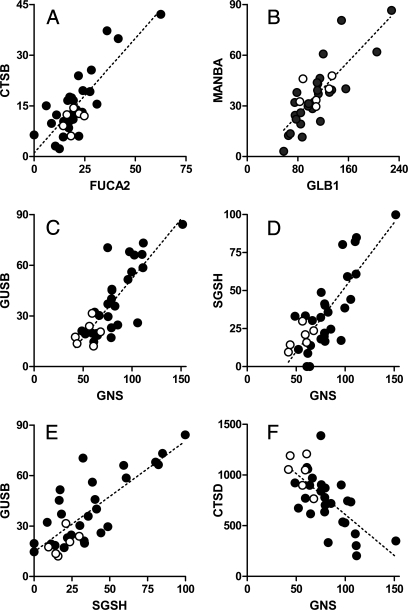
Fig. 1.
Coordinated expression of lysosomal proteins. Panels represent the following protein pairs: Panel A, chitobiase (CTBS) and plasma α-fucosidase (FUCA2), r2 = 0.673; Panel B, β-mannosidase (MANBA) and β-galactosidase (GLB1), r2 = 0.662; Panel C, β-glucuronidase (GUSB) and glucosamine (N-acetyl)-6-sulfatase (GNS), r2 = 0.655; Panel D, SGSH and glucosamine (N-acetyl)-6-sulfatase, r2 = 0.648; Panel E, β-glucuronidase and SGSH, r2 = 0.640; Panel F, CTSD and glucosamine (N-acetyl)-6-sulfatase, r2 = 0.480. For all plots, the linear relationship when considering controls and cases in aggregate was statistically significant (p < 0.0001), and the strength of the respective correlation is indicated by r2 values calculated from the Pearson correlation coefficient. Each point represents the spectral counts of the indicated two proteins associated with a given specimen with the raw data presented in supplemental Table 3. Filled and unfilled circles represent cases and controls, respectively.

