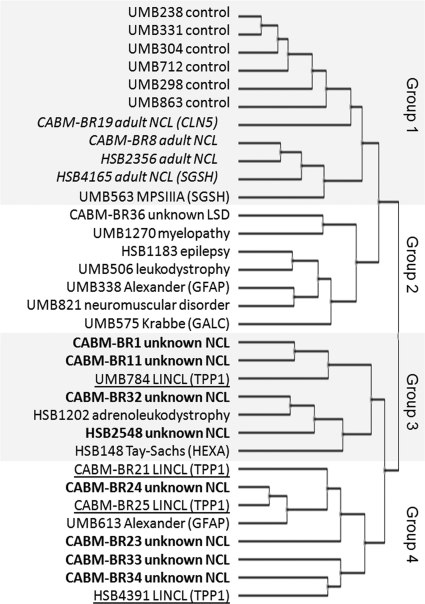
Fig. 4.
Hierarchical clustering dendrogram for normal controls and disease cases based upon relative abundance of lysosomal proteins. Normalized spectral count data (supplemental Table 2) were normalized by z-score transformation, and hierarchical cluster analysis was performed using the European Bioinformatics Institute Expression Profiler (37) using a correlation-based distance measure. Font coding indicates ANCL (indented italics), unknown NCL (bold), and LINCL (underlined).

