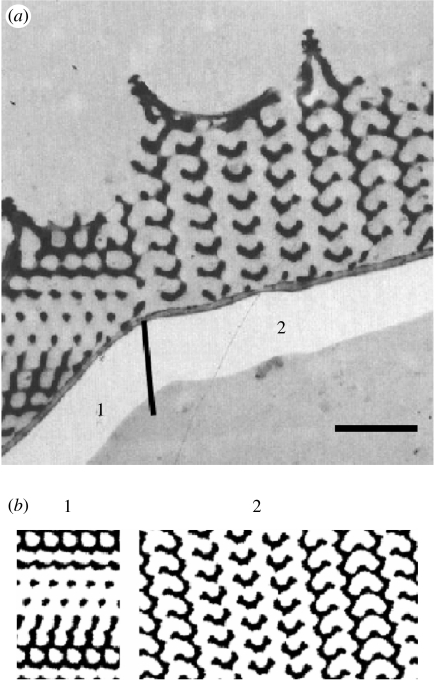
Figure 5.
(a) TEM micrograph showing a transverse section through a green scale of C. rubi. (Reproduced with permission from Ghiradella & Radigan (1976).) The numbers indicate various domains in the cuticle crystal. The vertical line indicates the position of the grain boundary. Scale bar, 1 μm. (b) Computer-simulated projections for a G-structure with t=−1.0 (equations (2.4) and (4.1)). The projections are generated from sections with a thickness of 0.2a (a denotes the length of the cubic unit cell) along the directions: 1, ; 2, [0 3 10]. The chitin (cuticle) structures appear black in both the micrograph and the simulation.

