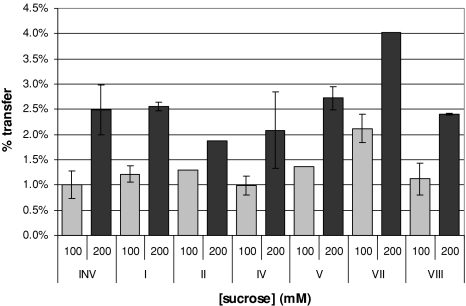
Fig. 5.
Transfer as a percentage of total hydrolysis plus transfer activity by the hydrolase acINV and its mutants at sites I–VIII (Table 2) incubated at 28°C for 20 min with different sucrose concentrations. Transfer is measured through the kestose produced and increases with increasing sucrose concentrations. Measurements from three independent protein expression experiments were analyzed, the error bars represent the standard error

