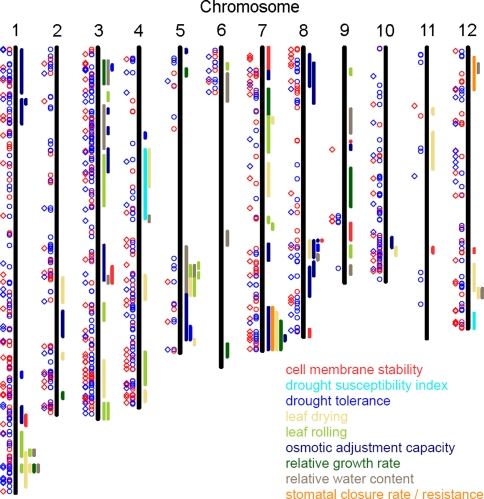
Fig. 5.
Published QTL related to drought tolerance in rice with a size below 5 Mb and location of genes with a significant E effect (circles) or a significant G × E effect (squares). Red symbols indicate repression of gene expression or interaction factor <−1.5, blue symbol induction of gene expression or interaction factor >1.5

