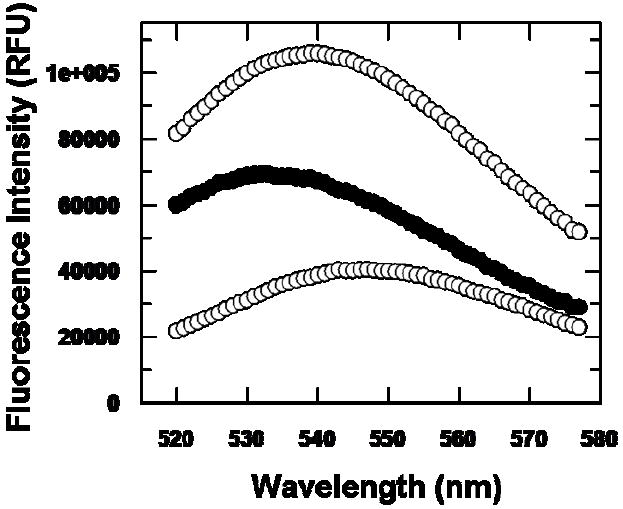
Figure 4.

Fluorescence enhancement of TNP-ATP upon binding to wild type HMDD. The lower (control) spectrum represents 5 μM TNP-ATP in buffer (containing 50 mM Tris-Cl (pH 7.0), 0.5 mM MgCl2, and 1 mM DTT). The upper spectrum represents fluorescence emission of a sample containing 5 μM TNP-ATP and 2.5 μM wild type human MDD in buffer. The middle spectrum indicates fluorescence enhancement of enzyme bound TNP-ATP (λmax~532 nm) as reflected by subtraction of the buffer control spectrum (TNP-ATP in buffer; lower trace) from the uncorrected spectrum (enzyme + TNP-ATP; upper trace). Excitation wavelength is 409 nm.
