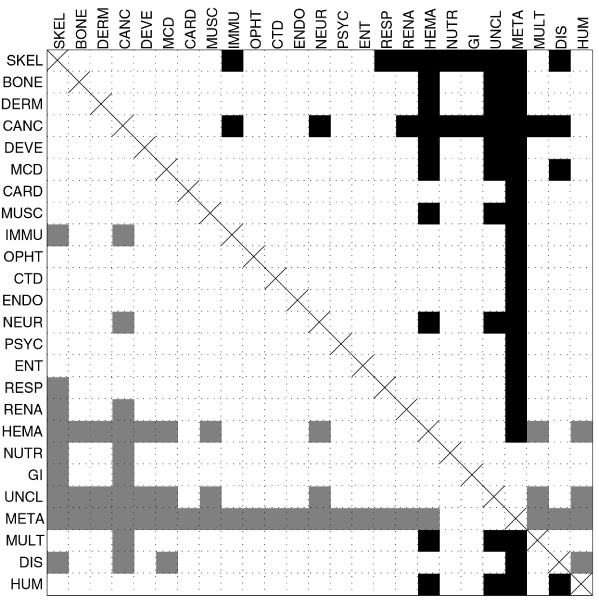
Figure 3.

Pairwise comparison of disorder content medians for disease classes and human gene class. Filled squares represent pairs for which adjusted Wilcoxon rank sum test p-values are smaller than α = 0.05 (p-values are adjusted for false discovery rate control with Benjamini-Yekutieli method). Squares are filled black if the median for the row class is greater than the median for the column class, or gray if the median for the row class is smaller than the median for the column class.
