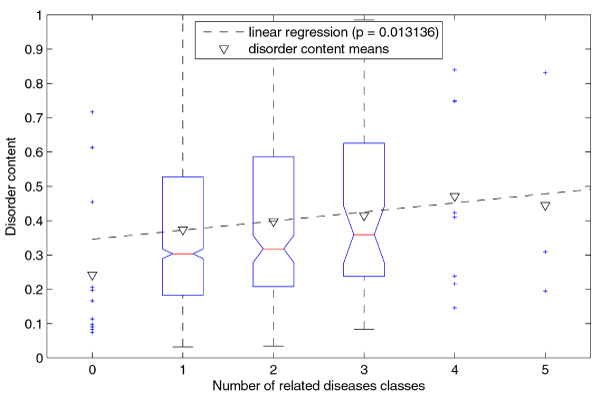
Figure 5.

Linear regression of disorder content with respect to number of related disease classes (for genes). The genes with number of related disease classes between 1 and 3 are represented as a boxplot, while the remaining genes are represented as points. Note that the disorder content means (inverted triangles) for subsets are greater than the respective medians, because the disorder content distributions in these subsets are positively skewed.
