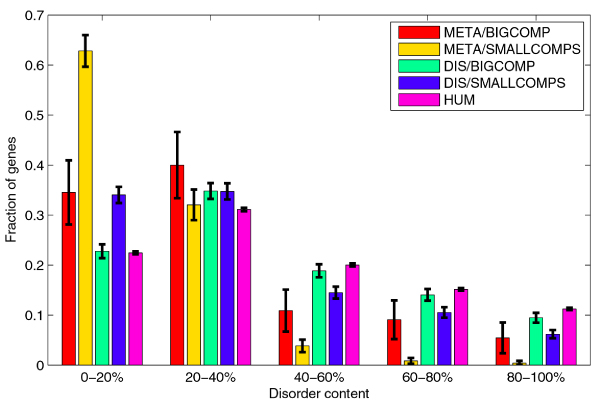
Figure 8.

Comparison of distributions of disorder content in LARGECOMP and SMALLCOMP for genes related to metabolic diseases, and for the whole disease gene set. Distribution of disorder content for human gene set is included for comparison. The error bars represent one standard deviation or 68.2% confidence interval.
