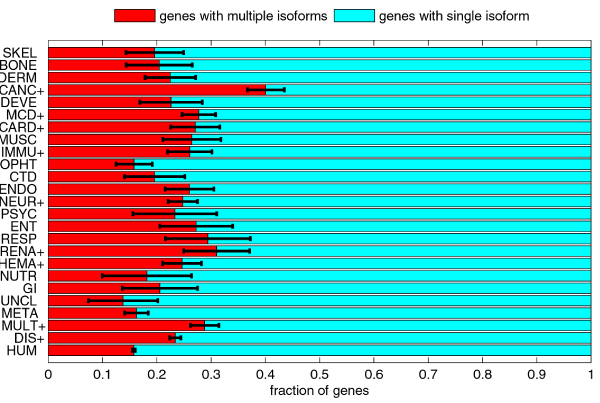
Figure 9.

Comparison of fractions of disease genes with multiple isoforms (i.e. with alternative splicing) and with single isoform. The classes with the + signs after their acronyms have significantly higher fraction of genes with multiple isoforms than the human gene set. The error bars represent one standard deviation or 68.2% confidence interval.
