Figure 1.
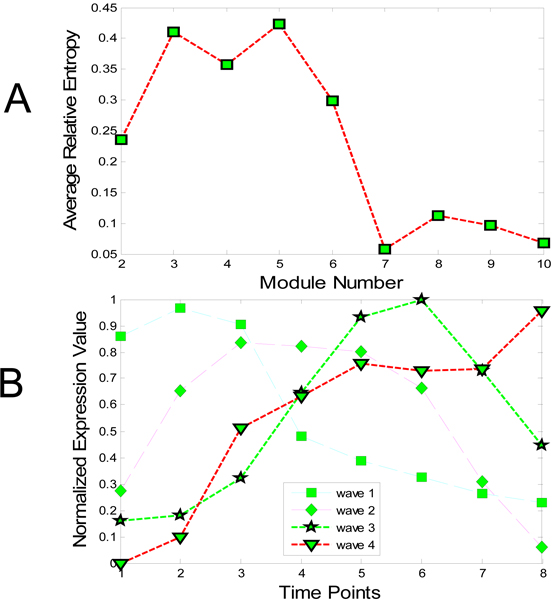
Module selection of rat CNS data. The module selection of rat CNS data is shown in these figures: A. Estimate of the optimal number of modules: the optimal number of FCM clustering is five, which agrees with the result presented in [16]. B. Four modules (waves) based on the optimal cluster number in A: the expression levels of the first four clusters are shown (the fifth cluster consists of diverse genes, not used for further analysis).

