
Figure 6.
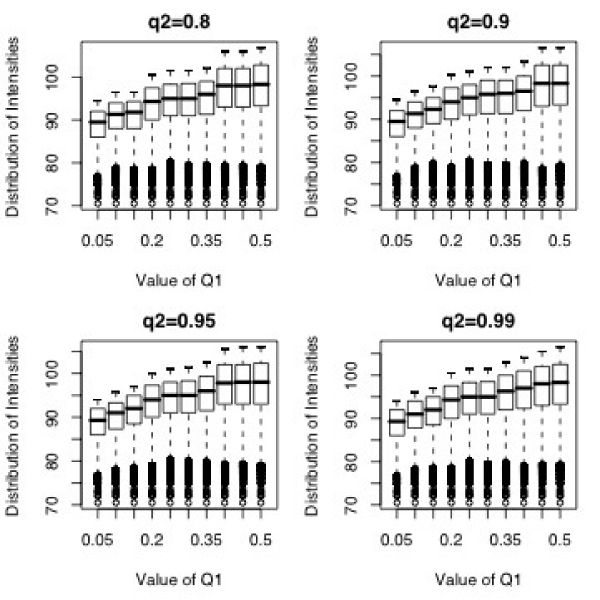
Boxplots for MM intensities for q1 ranging from 0.05 to 0.5, and q2 = 0.80 (left top), 0.90 (right top), 0.95 (left bottom), and 0.99 (right bottom). Our algorithm determined 0.25 to be the optimal value for q1. The value of q2 does not appreciably change the distribution of the MM intensities.