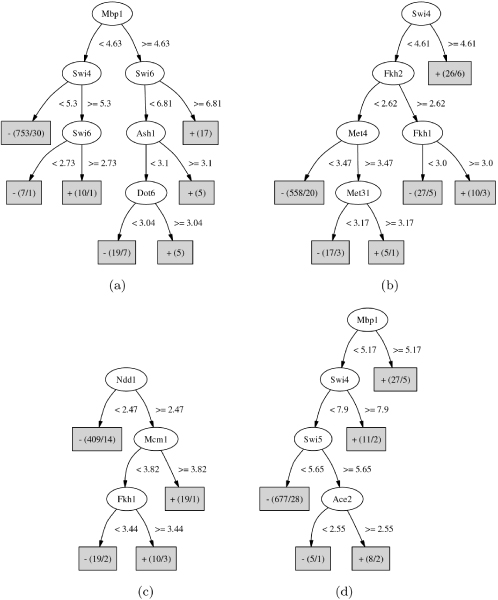
Figure 2.

Decision trees learned from the CDC28 cell cycle data set. (a) 20 minutes. (b) 40 minutes. (c) 70 minutes. (d) 100 minutes. Each oval represents an internal node and each box represents a leaf node. The text inside an internal nodes is a regulator, while the text associated with an edge is a test on a DNA binding p-value. The text inside a leaf node is a prediction of the state of a gene. The numbers of positive and negative genes are included in parentheses. For example, "+(19/1)" in the 40-minute tree means that the rule will predict positive and there are 19 genes satisfying this rule, of which 18 are true positive and the remaining one is false positive.
