
Figure 2. Reduced Functional Correlations Observed Anatomically.
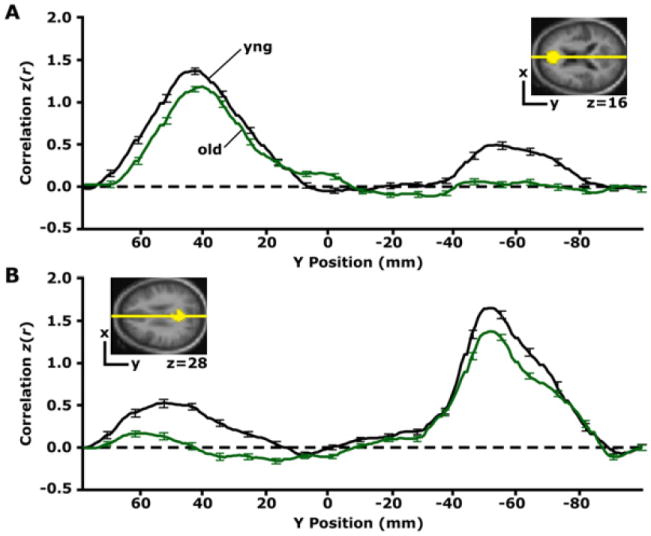
(A) The time course within the mPFC seed region, shown in yellow for only one transverse slice (z = 16) illustrated in the upper right, was correlated with every voxel in the brain. The graph displays the group-averaged z-transformed correlation coeffecient, z(r), plotted along a line connecting the center of the mPFC seed and the pC/rsp target regions (shown in [B]), for the anterior-posterior axis. This line is graphically represented in yellow on the transverse slice. The first leftward peak in the graph illustrates that the highest z(r) for both groups is localized to the mPFC seed region. Notice that although the young adult group (black line) exhibits functional correlations with the pC/rsp (indicated by the rightward peak), these correlations are minimally present in the older adult group. (B) A similar analysis was performed for a seed in the pC/rsp, shown for a single transverse slice illustrated in the upper left (z = 28). The yellow line is a graphical representation of a line connecting the center of the seed and the mPFC target (shown in [A]). The group-averaged z-transformed correlation coefficients are sampled along the line and plotted against the y position for both groups (black = young; green = old). Error bars = SEM.