
Figure 3. Reduced Functional Correlations Are Observed between Multiple Regions within the Large-Scale Brain System.
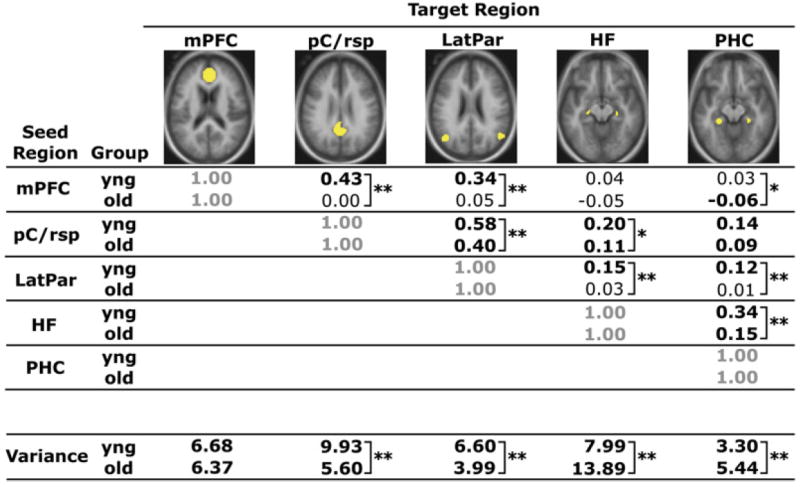
Correlation coefficients between a priori seed and target regions that comprise a large-scale brain system (the default network) are quantified for each group, with values significantly different from zero highlighted in bold (mPFC versus PHC: p < 0.05; all others: p < 0.001). The regions illustrated in yellow include the mPFC, pC/rsp, bilateral lateral parietal cortex (LatPar), bilateral hippocampal formation (HF), and bilateral parahippocampal cortex (PHC). The mean variance computed as the mean of the within-subject variances for each participant’s time course within each region is also listed at the bottom of the table. **Group t test significant at a Bonferroni corrected alpha of 0.005. *Group t test significant at an uncorrected alpha of 0.05.