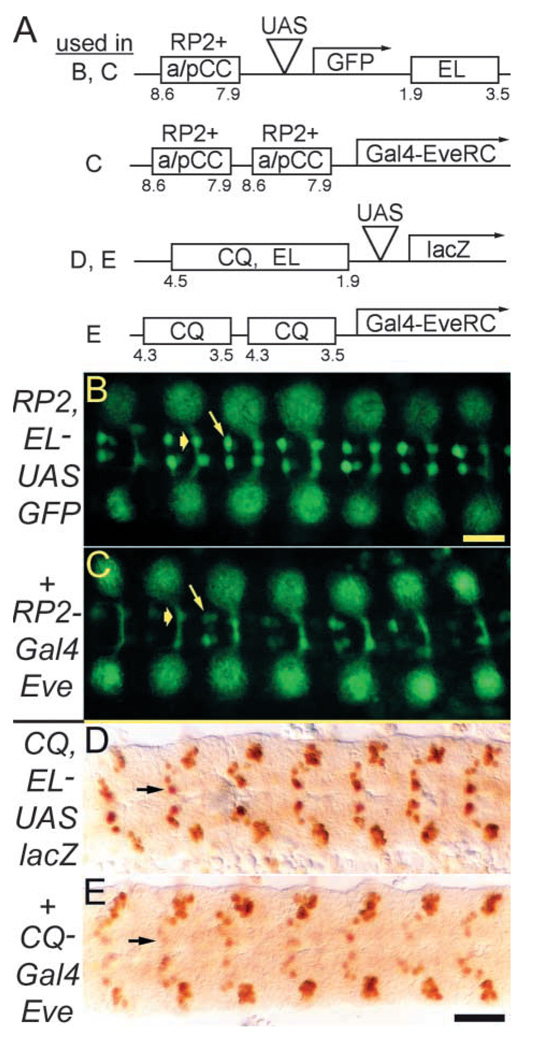
Fig. 7.
Eve exhibits active repression function in neurons. (A) The transgenes used here (see Materials and methods for details). (B) GFP expression driven by the first transgene. (C) GFP expression from the same transgene in the presence of the Gal4-EveRC repressor driven by the second transgene. Note that the intensity in RP2 (thin arrow) and a/pCC (wide arrow) is reduced compared with that in the internal control EL neurons (laterally located clusters, out of focus), where the repressor is not expressed. Yellow scale bar: 20 µm in B,C. (D) β-gal expression driven by the third transgene. (E) β-gal expression from the same transgene in the presence of the Gal4-EveRC repressor driven by the fourth transgene. Note that the intensity in U/CQ neurons (arrow) is reduced compared with that in EL neurons, where the repressor is not expressed. Black scale bar: 20 µm in D,E.

