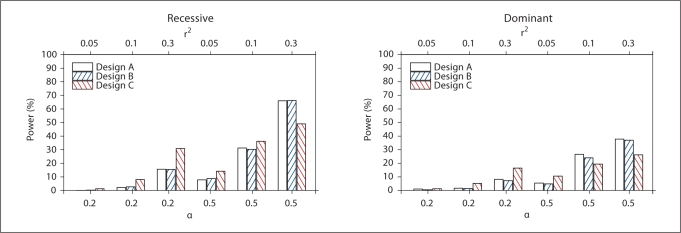
Fig. 2.
Power of Design A (all probands), B (probands from families with NPL ≥ 0) and C (probands from OSA-identified family subset) for Model 2 from table 1 (GxE). Power was defined as the proportion of replicates in which the associated SNP252 met the design-specific linkage threshold, had the smallest case-control association p value of the 101 markers analyzed by logistic regression, and met a Bonferroni correction for multiple testing. α: Proportion of linked families; r2: linkage disequilibrium between SNP252 and the DSL.

