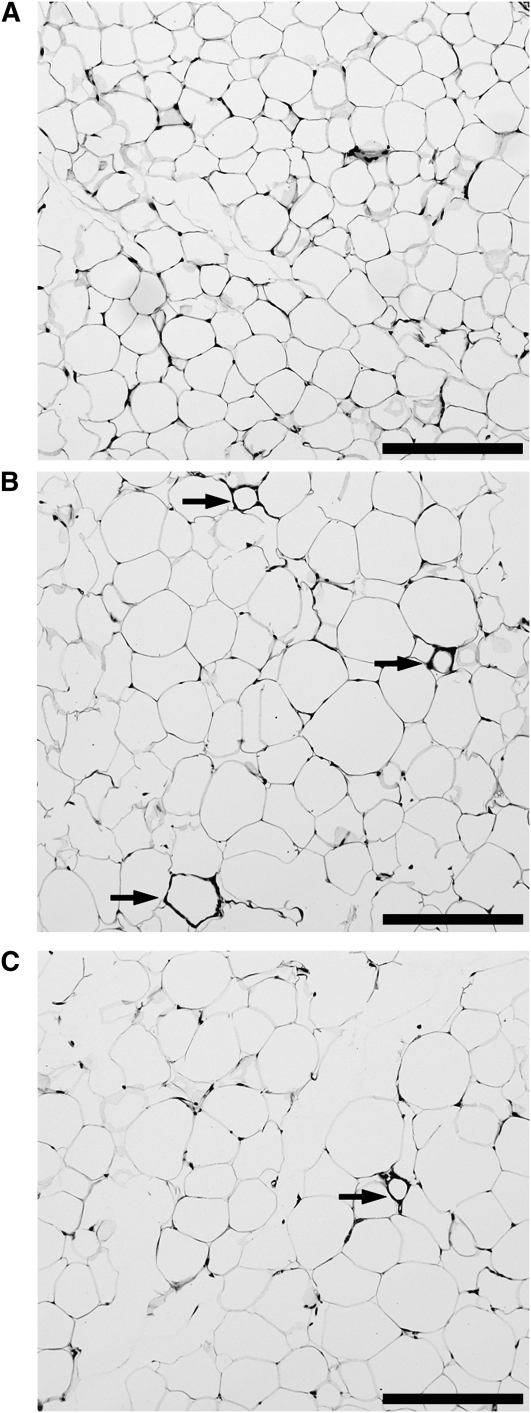
FIGURE 3 .
Frequency of dead adipocytes in mice fed the LFD (A), HFD (B), or HFD+B (C) for 8 wk. Representative hematoxylin- and eosin-stained histological sections of eAT from mice are shown. Dead adipocytes are indicated by CLS of ATMΦ surrounding remnant lipid droplets (arrows). Scale bar = 200 μm.

