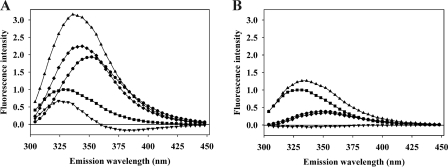
FIGURE 2.
Representative tryptophan fluorescence spectra of a (CR)3 fragment binding to cleaved PAI-1. A, 200 nm rccPAI-1 (■), 200 nm CR456 (●), 1:1 mixture of rccPAI-1 and CR456 (▴), difference spectrum between a 1:1 mixture of rccPAI-1 and CR456 and rccPAI-1 (♦), and difference spectrum between a 1:1 mixture of rccPAI-1 and CR456 and the sum of spectra of rccPAI-1 and CR456 (▾). B, effect of 10 mm EDTA added to buffer. 200 nm rccPAI-1 (■), 200 nm CR456 (●), 1:1 mixture of rccPAI-1 and CR456 (▴), difference spectrum between 1:1 mixture of rccPAI-1 and CR456 and rccPAI-1 (♦), and difference spectrum between 1:1 mixture of rccPAI-1 and CR456 and the sum of spectra of rccPAI-1 and CR456 (▾). Note that the much lower intensity of the spectrum of CR456 in the presence of EDTA compared with the Ca2+ complex in A is as expected from the typical large increase in tryptophan fluorescence of CR domains upon binding Ca2+ (20).

