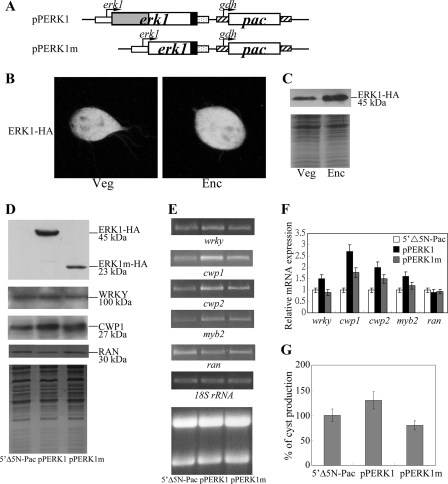
FIGURE 8.
Induction of wrky and cwp1-2 gene expression in the ERK1-overexpressing cell line. A, diagrams of the pPERK1 and pPERK1m plasmids. The pac gene (open box) expression cassette is the same as in Fig. 2C. The erk1 gene is under the control of its own 5′-flanking region (open boxes) and the 3′-flanking region of the ran gene (dotted box). ERK1m does not contain the predicted kinase domain (residues 26–202) (gray box). The filled box indicates the coding sequence of the HA epitope tag. B, cytosolic localization of ERK1. The pPERK1 stable transfectants were cultured in growth medium (Veg) or encystation medium, harvested at 24 h (Enc), and then subjected to immunofluorescence analysis using anti-HA antibody for detection. The left and right panels show that the product of pPERK1 localizes to the cytosol and flagella in vegetative and encysting trophozoites, respectively. C, ERK1 protein levels in pPERK1 stable transfectants. The pPERK1 stable transfectants were cultured in growth medium (Veg) or encystation medium and harvested at 24 h (Enc). HA-tagged ERK1 protein was detected using an anti-HA antibody by Western blot analysis. Coomassie-stained total protein loading control is shown below. D, overexpression of ERK1 increased the levels of WRKY and CWP1. The 5′Δ5N-Pac, pPERK1, and pPERK1m stable transfectants were cultured in growth medium and then subjected to SDS-PAGE and Western blot. The blot was probed by anti-HA, anti-WRKY, and anti-CWP1 antibody. Equal amounts of proteins loaded were confirmed by detection of giardial RAN protein. Representative results are shown. E, RT-PCR analysis of gene expression in the ERK1- and ERK1m-overexpressing cell line. The 5′Δ5N-Pac, pPERK1, and pPERK1m stable transfectants were cultured in growth medium and then subjected to RT-PCR analysis. PCR was preformed using primers specific for wrky, cwp1, cwp2, myb2, ran, and 18 S ribosomal RNA genes. Ribosomal RNA loading controls are shown in the bottom panel. F, quantitative real time PCR analysis of gene expression in the ERK1- and ERK1m-overexpressing cell line. Real time PCR was preformed using primers specific for wrky, cwp1, cwp2, myb2, ran, and 18 S ribosomal RNA. Transcript levels were normalized to 18 S ribosomal RNA levels. -Fold changes in mRNA expression are shown as the ratio of transcript levels in pPERK1 or pPERK1m cell line relative to the 5′Δ5N-Pac cell line. Results are expressed as the means ± S.E. of at least three separate experiments. G, overexpression of ERK1 increased cyst formation. The 5′Δ5N-Pac, pPERK1, and pPERK1m stable transfectants were cultured in growth medium. Cyst count was performed on the late log/early stationary phase cultures (1.5 × 10⁶ cells/ml). The sum of total cysts is expressed as relative expression level over control. Values are shown as means ± S.E.

