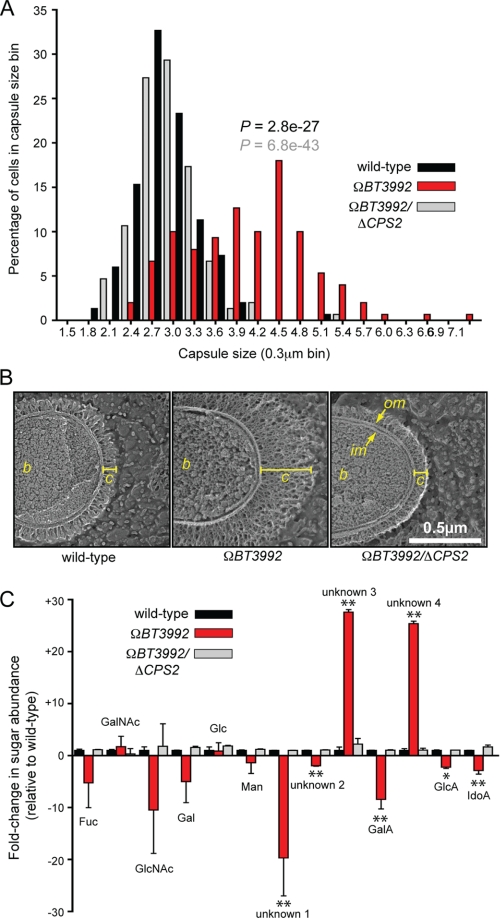
FIGURE 5.
Capsule production by the ΩBT3992 mutant. A, histogram plot of capsule sizes determined by India ink staining of the isogenic wild-type (black bars), ΩBT3992 (red bars), and the ΩBT3992/ΔCPS2 double mutant (gray bars) strains. Capsule sizes from a total of 150 individual cells were measured for each strain, 50 from each of three different experiments. p values are provided above the ΩBT3992 distribution and are color-coded based on the dataset (wild-type or double mutant) to which the ΩBT3992 distribution was compared. Representative images of India ink-stained encapsulated cells are provided in supplemental Fig. S5. B, quick-freeze, deep-etch scanning electron micrographs of wild-type and ΩBT3992 and ΩBT3992/ΔCPS2 double mutant cells, illustrating their capsule morphology. The capsule appears thicker in the ΩBT3992 mutant but of similar density as the other two strains. The width of each capsule (c) is indicated by a yellow line. The bacterial cell (b), inner membrane (im), and outer membrane (om) are labeled for reference. Magnification is 50,000×. C, analysis of monosaccharides present in wild-type and ΩBT3992 and ΩBT3992/ΔCPS2 double mutant capsules. A total of 13 different sugars were differentiated by HPAEC-PAD; nine of these eluted at the same time as known monosaccharide standards (see labels above histogram bars), whereas four compounds (labeled as unknown 1–4) did not correspond to any known standards used. Note the abundance of two uniquely represented and unknown sugars (unknowns 3 and 4) in the ΩBT3992 capsule. Total extracellular polysaccharides were extracted from cells grown in MM-glucose, and three biological replicates were performed for each strain. Values shown represent the average -fold increase of each sugar relative to the average present in wild-type cells, and error bars represent the S.D. Instances where sugar abundance in the ΩBT3992 mutant differed significantly from wild-type are indicated with asterisks (*, p ≤ 0.05; **, p ≤ 0.01 by Student's t test). Histogram bars are arranged along the x axis based on their elution points under the HPAEC-PAD conditions used (negative charge increases toward the right side of the graph). Representative HPAEC-PAD traces are provided in supplemental Fig. S6. Fuc, fucose; GalA, galacturonic acid; GlcA, glucuronic acid; IdoA, iduronic acid.

