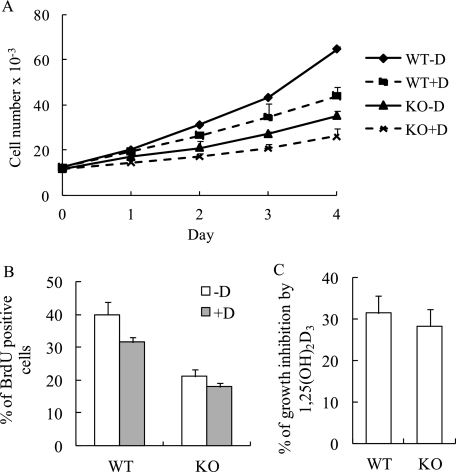
FIGURE 3.
MN1 knock-out osteoblasts have reduced growth rate. A, WT and MN1 KO primary osteoblasts were plated at a density of 1 × 10³ cells/cm2 and treated with ethanol vehicle (-D) or 10 nm 1,25(OH)2D3 (+D) at day 0. Trypan blue-excluding cells were counted at the indicated time points. Data represent the mean ± S.D. (n = 3 in each group). B, MN1 WT and KO primary osteoblasts were plated at equal densities and treated with ethanol vehicle (-D) or 10 nm 1,25(OH)2D3 (+D) for 72 h. Cells were labeled with BrdUrd, and the BrdUrd-positive cells were quantitated. Data represent the mean ± S.D. (n = 3 in each group). C, the percentage of growth inhibition by 4-day treatment of 10 nm 1,25(OH)2D3 from three independent MTT assays. Data represent the mean ± S.D. (n = 3 in each group).

