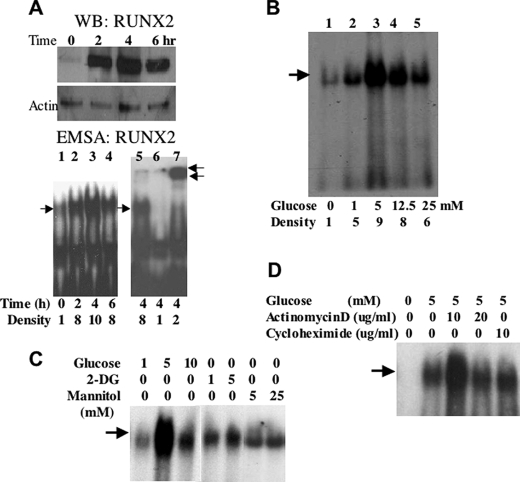
FIGURE 1.
Glucose-activated RUNX2 DNA binding activity in EC. A, confluent ECs were starved overnight and treated with 5 mm glucose for the indicated time. RUNX2 protein was measured by Western blotting (WB RUNX2), and RUNX2 DNA binding activity was determined by EMSA (EMSA RUNX2) using a specific radiolabeled nucleotide from the osteocalcin promoter, which contains a RUNX2 consensus-binding site. Excess (100-fold) cold, unlabeled oligonucleotide (lane 6) was used to verify specific RUNX2 binding, and a RUNX2-specific antibody (0.2 μg) was used to induce a super-shifted band and confirm the presence of RUNX2 in the DNA-binding complex (lane 7). Single arrow indicates RUNX2 shift; double arrows indicate RUNX2 supershift. Relative RUNX2 band density (single arrow) is indicated below each lane. B, ECs were treated with the indicated concentrations (mm) of glucose for 4 h, and DNA binding activity was measured by EMSA. Relative RUNX2 band density at each glucose concentration is indicated. C, glucose (1, 5, and 10 mm), mannitol (5 and 25 mm), or 2-DG (1 and 5 mm) were used to treat starved HBME cells for 4 h. DNA binding was measured by EMSA. Arrow indicates RUNX2-shifted band. D, actinomycin D (10 and 20 μg/ml) or cycloheximide (10 μg/ml) was used to inhibit gene transcription or protein synthesis, respectively. Arrow indicates the specific RUNX2-shifted band on the EMSA gel.

