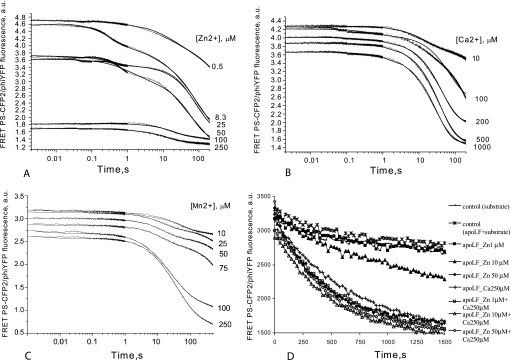
FIGURE 4.
Activation of LF apoenzyme by addition of Zn2+ (A), Ca2+ (B), Mn2+ (C), and Zn2+ with Ca2+ (D) was analyzed using LF15P as the substrate. To ensure that the enzyme was inactive at the start of data collection, reaction components (apo-LF and substrate/metal solution) were stored separately in loading syringes and mixed in the measuring cell of the stopped-flow apparatus (for A, B, and C). The concentration of LF15P was 0.25 μm, and the apo-LF concentration was 0.25 μm. Concentrations of divalent metal ions are indicated to the right of the panels. Fig. 2D, scheme 4, was fitted to Zn2+ data, whereas Fig. 2E, scheme 5, describes the mechanisms for Ca2+ and Mn2+. The calculated kinetic parameters are shown in Table 5. D, steady-state kinetics of LF15P cleavage by LF apoenzyme, activated with different concentrations of Zn2+ and Ca2+ and combinations thereof. Legends for respective curves are shown to the right of the graph. The assay was tailored to investigate the possibility of LF activation by low concentrations of Zn2+ in the presence and in the absence of saturating concentration of Ca2+. Concentration of apo-LF was 20 nm, and concentration of LF15P was 1.6 μm. Control reactions contained either uncharged apo-LF with substrate (asterisks) or substrate alone (line marked with small rectangles). Kinetic data for 1, 10, and 100 nm Zn2+ is not shown because of full coincidence with control curves.

