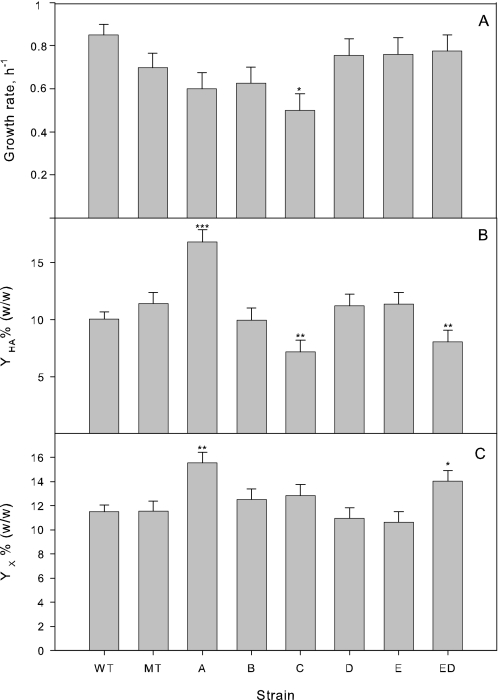
FIGURE 4.
Growth rates and yields during mid-exponential growth. Yields of HA and biomass are in mass percentage on glucose. Error bars indicate 95% confidence intervals standard error for the mean estimates. Statistical tests were performed against empty plasmid control (MT) and p values indicated by the range: 0 < *** ≤ 0.001 ≤ ** ≤ 0.01 ≤ * ≤ 0.05 ≤ no asterisk ≤ 1.

