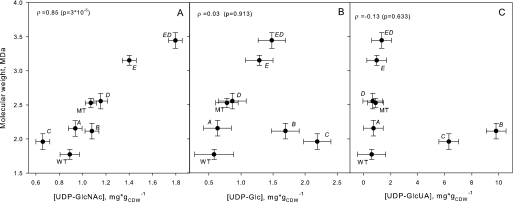
FIGURE 5.
Molecular weight versus UDP-sugar concentrations. The observed mean molecular weight is plotted against mean UDP-sugar level for each strain. Error bars indicate standard error of mean estimates. The Spearman's rank correlation ρ was calculated for each UDP-sugar versus molecular weight combination and tested for the hypothesis of no correlation, ρ = 0. p values for tests are shown in brackets.

