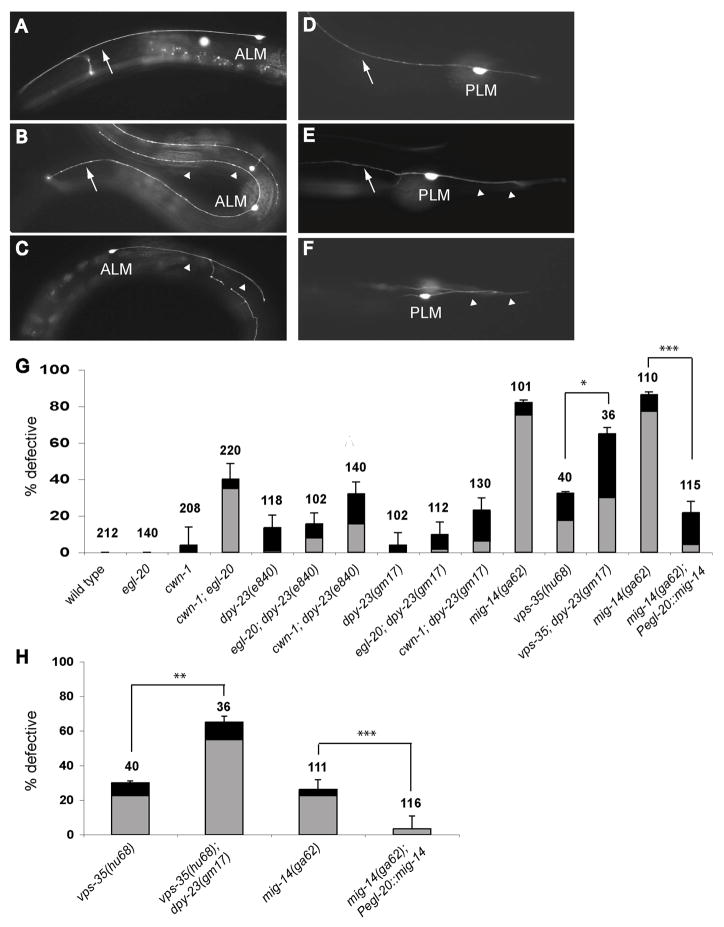
Figure 2. dpy-23, mig-14, and vps-35 Mutants Display Defective ALM and PLM Neuronal Polarity.
(A–F) Photomicrographs showing ALM (A–C) and PLM (D–F) neuronal morphology. The ALM and PLM cell bodies are labeled. Anterior processes are indicated by arrows and posterior processes by arrowheads. (A) Wild-type ALM with a single, anterior process. (B) Bipolar ALM with a normal anterior process and an ectopic posterior process. (C) ALM with a single posterior process, indicating a reversal of polarity. (D) Wild-type PLM with a long anterior process and a short posterior process. (E) PLM with symmetric polarity. The cell has a normal anterior process and a long posterior process. (F) PLM with reversed polarity. The anterior process is short, and the abnormally long posterior process often folds back on itself at the tip of the tail and projects anteriorly. (G, H) Graph shows the percentage (with S.E.M.) of ALM (G) and PLM (H) neurons with defective polarity for each genotype. Black bars indicate the bipolar phenotype, and gray bars indicate reversed polarity. Numbers of axons scored for each genotype are provided. * p < 0.05; ** p < 0.01; *** p < 0.001, Fisher’s exact test.

