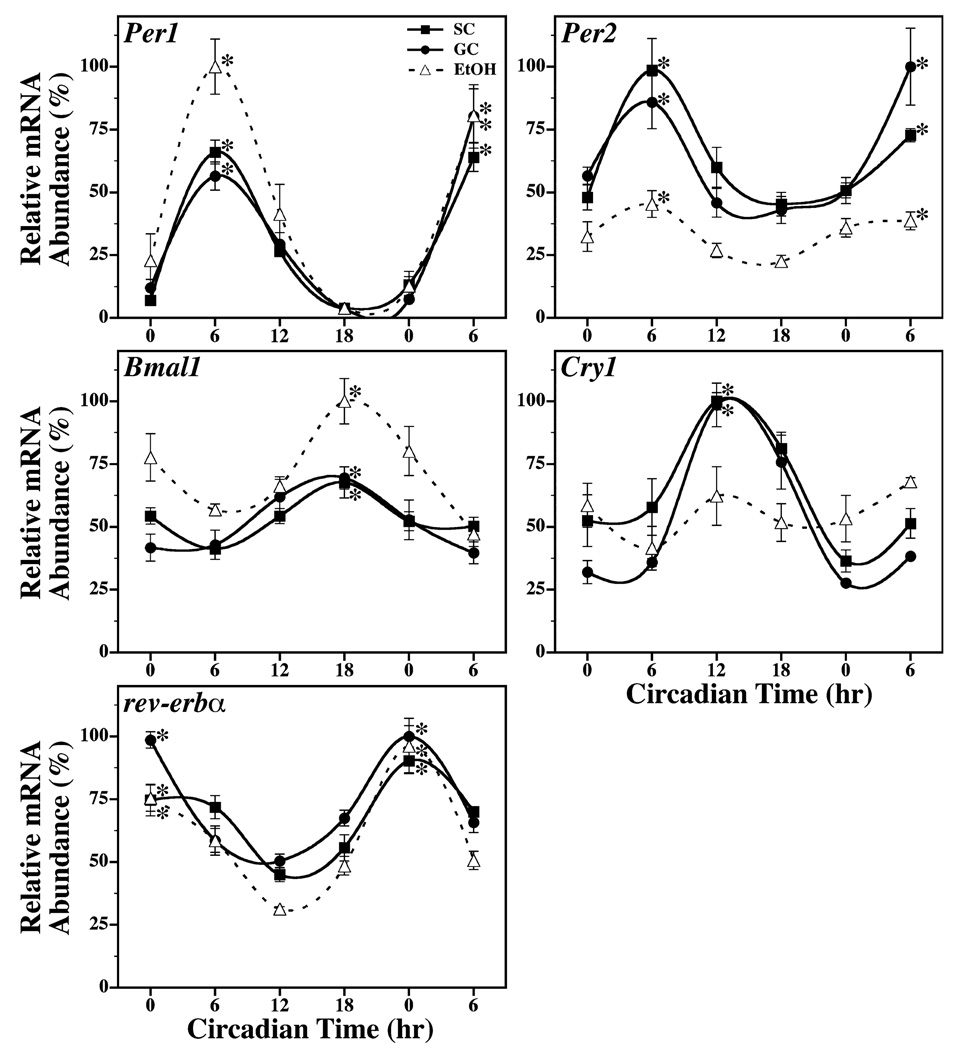
Fig. 1.
Temporal patterns of Per1, Per2, Bmal1, Cry1 and rev-erbα mRNA expression in the SCN of suckle control (SC, ■), gastrostomy control (GC, ●), and alcohol-treated (EtOH, Δ) rats during exposure to constant darkness. Symbols denote real-time PCR determinations of mRNA levels (mean ± SEM) in SCN tissue collected from 4 to 5 animals at 6-hour intervals for 30 hours. The plotted values correspond to the ratios of species-specific Per1, Per2, Bmal1, Cry1 or rev-erbα / CypA mRNA signal and are represented as a percentage of the maximal value obtained among all groups. Asterisks indicate time points during which peak values for SCN expression of a given gene were significantly greater (p < 0.05) than those observed during preceding or succeeding minima.

