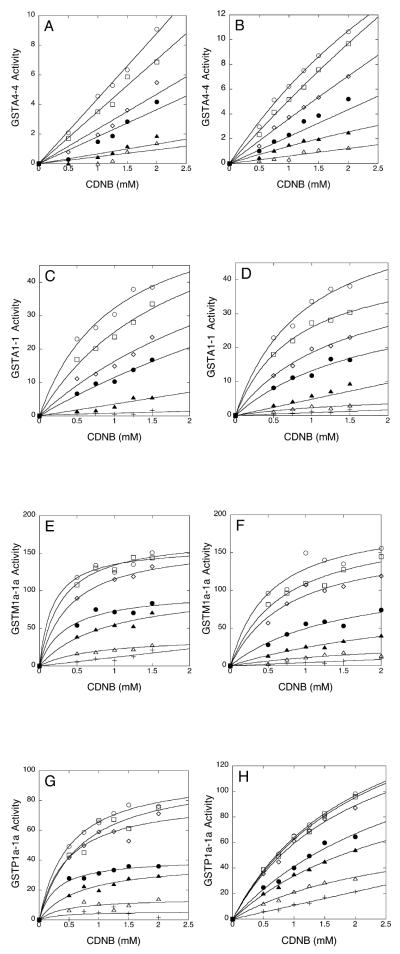
Figure 6. Inhibition of GST activity by nitroalkene fatty acids.
Shown are the kinetics of inhibition of the indicated isozymes of GST by NO2-OA (panels A, C, E, and G) and by NO2-LA (panels B, D, F, and H). GST activities are expressed as the initial velocities of glutathione conjugation with 1-chloro-2,4-dintrobenzene (CDNB) (mol•min-1•mg enzyme-1) as a function of CDNB concentration. Open circles represent no added nitroalkene while open squares, open diamonds, closed circles, closed triangles, open triangles, and crosses represent increasing concentrations of nitroalkene fatty acids (panels A and B: 0.1, 0.5, 1.0, 2.5 and 5.0 μM; panels C and D: 0.1, 0.25, 0.5, 1.0, 2.5 μM; and panels E-H: 0.005, 0.01, 0.05, 0.1, 0.25, and 0.5 μM NO2-OA or NO2-LA).

