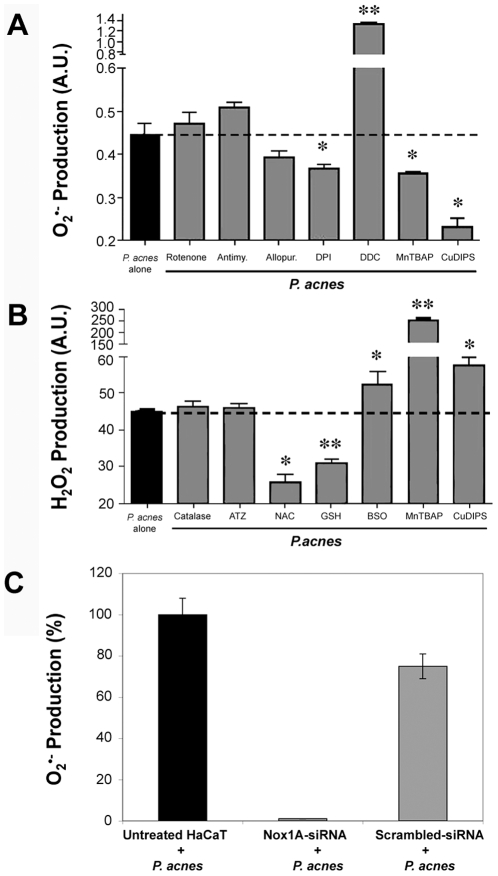
Figure 4. ROS detoxification pathways involved in P. acnes-stimulated keratinocytes.
(A) Superoxide anions and (B) hydrogen peroxide productions by HaCaT cells were determined after incubation for 18 h with P. acnes (MOI of 50) alone (black bars) or with P. acnes in the presence of specific modulators of enzymatic systems involved in ROS metabolism (gray bars). The concentrations used were the following: 40 µM rotenone, 40 µM antimycin, 40 µM allopurinol, 40 µM DPI, 2 mM DDC, 400 µM ATZ, 0.8 mM BSO, 100 µM manganese [III] tetrakis (5,10,15,20)-benzoic acid porphyrin (MnTBAP), 400 µM copper[II]diiosopropylsalicylate (CuDIPS), 3.2 mM N-acetylcysteine (NAC), 1.6 mM GSH, 20 U catalase. (C) HaCaT cells were pretreated with the Nox1A-siRNA sequence or with a scrambled sequence as described in Materials and Methods. Superoxide anions production was measured after stimulation by P. acnes (MOI of 50) in untreated HaCaT (black bar) or in siRNA pretreated HaCaT (gray bars). ROS production was measured by spectrofluorometry as described in Materials and Methods. Data are means±DS of two separate experiments.

