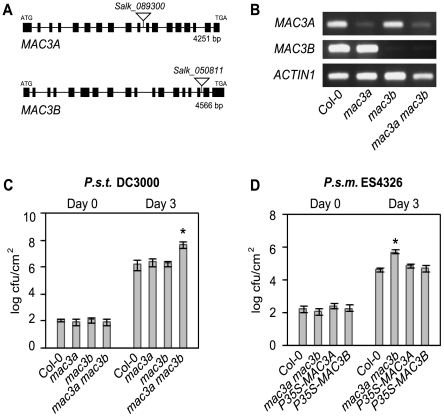
Figure 2. MAC3A and MAC3B function redundantly in basal defense.
(A) Gene structures of MAC3A (At1g04510) and MAC3B (At2g33340) showing the position of T-DNA insertions Salk_089300 (mac3a) and Salk_050811 (mac3b). Lines indicate introns and boxes indicate exons. The location of translation start (ATG) and stop (TGA) codons are found in the first and last exons, as indicated. (B) Expression levels of MAC3A and MAC3B in Col-0, mac3a, mac3b, and mac3a mac3b mutants as indicated by semi-quantitative RT–PCR using cDNA–specific primers flanking the T–DNA insertion sites. (C) Growth of P.s.t. DC3000 at 0 and 3 days post-inoculation. Values represent an average of four replicates±SD. An unpaired Student's t-test was used to analyze the statistical significance of bacterial growth compared to Col-0. Asterisk indicates P<0.001. (D) Growth of P.s.m. ES4326 at 0 and 3 days post-inoculation. P35S-MAC3A-CFP and P35S-MAC3B are expressed in the mac3a mac3b background. Values represent an average of four replicates±SD. An unpaired Student's t-test was used to analyze the statistical significance of bacterial growth compared to Col-0. Asterisk indicates P<0.0001. Experiments were repeated at least three times with similar results.

