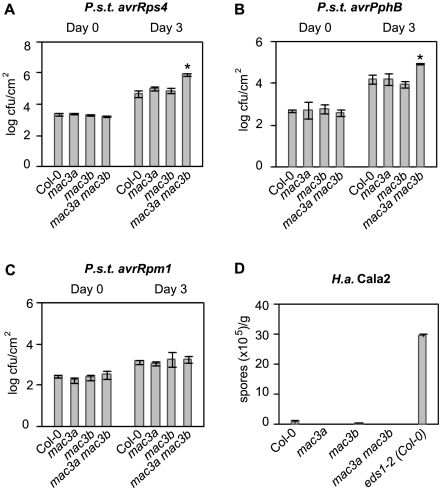
Figure 3. MAC3A and MAC3B function redundantly in specific R-protein–mediated resistance pathways.
(A–C) Growth of the bacterial pathogens P.s.t. avrRps4, P.s.t. avrPphB, and P.s.t. avrRpm1 at 0 and 3 days post-inoculation. Values represent an average of four replicates±SD. An unpaired Student's t-test was used to analyze the statistical significance of bacterial growth compared to Col-0. Asterisks indicate P<0.0005. (D) Growth of avirulent H.a. isolate Cala2 seven days post-inoculation on 2-week-old seedlings. eds1-2 introgressed in Col-0 was used as a positive control for pathogen growth. Values represent an average of two replicates of at least 20 plants per genotype±SD. All experiments were repeated at least three times with similar results.

