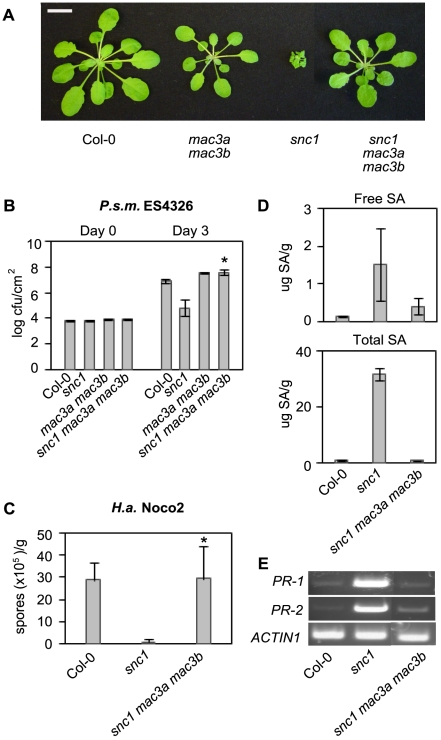
Figure 4. Suppression of snc1-associated phenotypes by mac3a mac3b.
(A) Morphology of Col-0, mac3a mac3b, snc1, and snc1 mac3a mac3b plants. Soil-grown plants were photographed 4 weeks after germination. Size bar represents 1 cm. (B) Growth of P.s.m. ES4326 at 0 and 3 days post-inoculation. Values represent an average of four replicates±SD. P values were calculated using an unpaired Student's t-test comparing the mean bacterial growth in snc1 to that in snc1 mac3a mac3b. Asterisk indicates P<0.0005. (C) Growth of the H.a. isolate Noco2 seven days post-inoculation on 2-week-old seedlings. Values represent an average of 4 replicates of at least 20 plants per genotype±SD. P values were calculated using an unpaired Student's t-test comparing oomycete growth in snc1 compared to that in snc1 mac3a mac3b. Asterisk indicates P<0.01. (D) Free and total SA was extracted from leaf tissue from 3-week-old soil-grown plants and analyzed by HPLC. Values represent the average of 4 replicates±SD. (E) Semi-quantitative RT–PCR of the pathogenesis-related genes PR-1 and PR-2. Actin1 was included as a control. All experiments were repeated at least twice with similar results.

